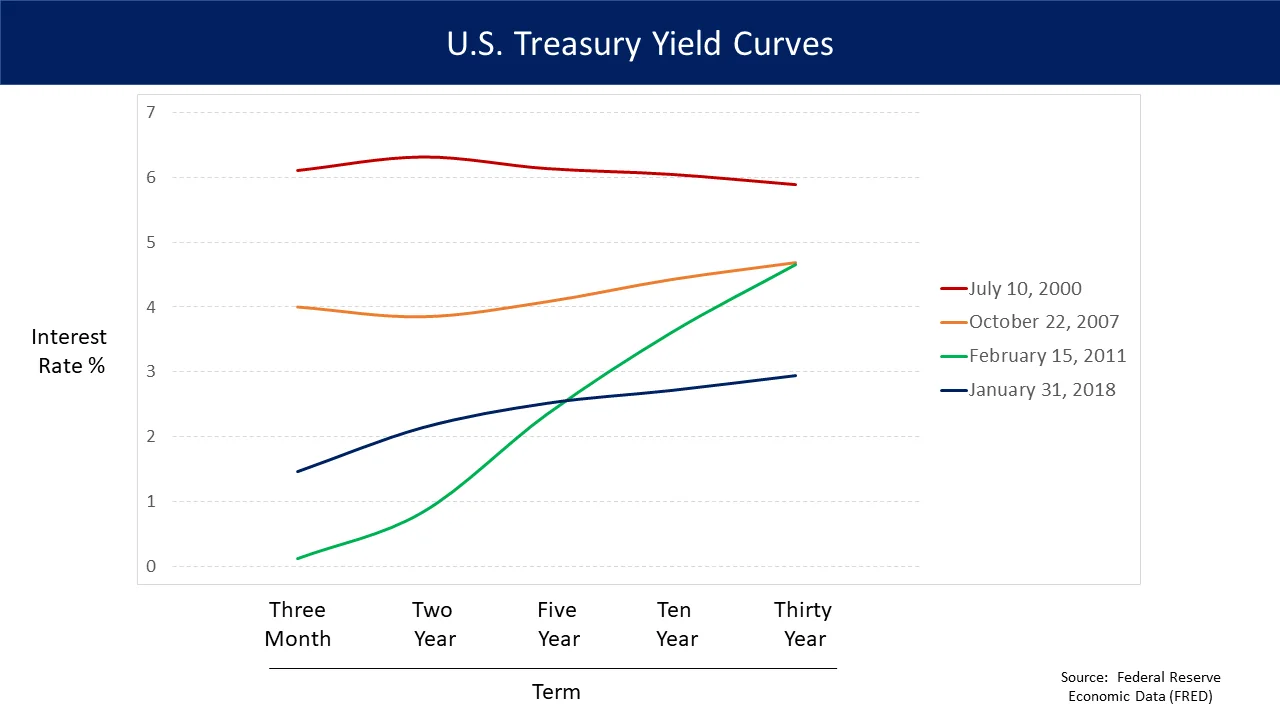
Few charts in finance get as much attention as the yield curve. Economists watch it for signs of recession, banks depend on it for profits, and central bankers study it to see whether markets believe their plans. Yet the idea behind it is simple: it shows how much it costs the government to borrow money for different lengths of time.
What the Yield Curve Is
When the U.S. Treasury borrows, it issues securities that mature anywhere from a few weeks to 30 years. Each one pays a yield, which is the annual return an investor earns for holding it. The yield curve is a line that plots those yields from the shortest maturity to the longest. Short-term yields are heavily influenced by the Federal Reserve, because they track the interest rate the Fed sets. Long-term yields are set mostly by investors, and they reflect expectations about future growth, future inflation, and where the Fed will take rates over time. The curve is therefore a snapshot of what the bond market thinks comes next.
The Three Shapes
A normal yield curve slopes upward. Lending money for 10 years carries more risk than lending it for three months, since inflation could rise or better opportunities could appear, so investors demand a higher return for the longer commitment. An upward slope usually signals that markets expect steady growth. A flat curve appears when short-term and long-term yields are close together. This often happens during transitions, when the Fed is raising rates and investors are unsure how long growth will last. An inverted curve slopes downward, meaning short-term debt pays more than long-term debt. Inversions occur when investors expect the economy to weaken and interest rates to fall in the future. They buy long-term bonds to lock in current yields, which pushes those yields down below short-term rates.
Why Inversions Get So Much Attention
The inverted yield curve has one of the best forecasting records in economics. The most common measure compares the 10-year Treasury yield with the 2-year yield. Since the 1970s, every U.S. recession has been preceded by this spread turning negative, typically somewhere between six months and two years in advance. The signal is not perfect. The curve inverted in 2022 and stayed that way into 2024, the longest stretch on record, and the recession many forecasters predicted did not arrive on schedule. An inversion says that investors expect trouble. It does not say when it will come or how severe it will be.
How It Affects Banks and Borrowers
The yield curve matters outside of forecasting because it shapes lending. Banks borrow short term, mostly through deposits, and lend long term through mortgages and business loans. When the curve slopes upward, the gap between what they pay and what they earn is wide, and lending is profitable. When the curve flattens or inverts, that gap shrinks, banks become more cautious, and credit gets harder to obtain. Households feel this too. Mortgage rates tend to follow the 10-year Treasury yield, while credit card and auto loan rates follow short-term rates. A shift in the curve can make one type of borrowing cheaper while another becomes more expensive.
Conclusion
The yield curve compresses millions of investment decisions into a single line. Its slope reveals whether investors expect growth or slowdown, whether they trust the central bank to control inflation, and how easily credit will flow through the economy. It should be read as a measure of expectations rather than a guarantee. Used alongside data on jobs, prices, and spending, it remains one of the most useful tools for understanding where the economy may be headed.